


Analysis of the Progressive Nature of the Federal Fiscal System
Underlying every fiscal policy discussion in Washington is the question of progressivity: how much should taxA tax is a mandatory payment or charge collected by local, state, and national governments from individuals or businesses to cover the costs of general government services, goods, and activities. and spending policy redistribute from high-income households to low-income households?
This debate is often more rhetorical than substantive, but a recent study by the Congressional Budget Office (CBO) fills this void by presenting data showing that the current fiscal system—both taxes and direct federal benefits—is very progressive and highly redistributive, and it is becoming more so each year.
The goal of this annual CBO study is to estimate how federal fiscal policy—both taxes and direct federal benefits—impacts household incomes. The report estimates how much households in various income groups benefited from social insurance programs (such as Social Security and Medicare) as well as means-tested transfer programs (such as Medicaid, SNAP, and Supplemental Security Income) in 2021.
In addition to these standard benefit programs, most households received substantial COVID relief in 2021. According to CBO, three relief programs alone—the recovery rebate credit, the expanded child tax creditA tax credit is a provision that reduces a taxpayer’s final tax bill, dollar-for-dollar. A tax credit differs from deductions and exemptions, which reduce taxable income, rather than the taxpayer’s tax bill directly., and expanded unemployment compensation—increased incomes on average by more than $720 billion, or about $5,500 per household.
CBO then contrasts the total benefits households received in 2021 with the estimated total federal taxes they paid—including individual income taxes, payroll taxes, corporate income taxes, estate taxes, and various excise taxes.
As we will see, these progressive policies lift the incomes of households that receive more in federal benefits than they pay in total federal taxes while reducing the income of households that pay more in federal taxes than they receive in direct benefits.
CBO’s data allows us to measure the impact of these policies on the average household within various income groups and then aggregate the results to measure how these policies redistribute income between groups of households.
To be sure, households do benefit from other federal programs—such as national defense, highway spending, and public education—but CBO does not include the benefits of such programs in this exercise. The study is solely focused on fiscal policy that directly impacts household incomes.
Direct Federal Benefits Lifted Average Incomes for All but Upper-Income Households
Table 1 illustrates how federal benefit programs and taxes can either raise market incomes or reduce them. For example, in 2021, households in the lowest quintile not only paid no federal income taxes, but they also received an average of $5,200 in refundable tax credits, such as the expanded child tax credit. In addition, they received $28,200 in transfer benefits, for a total of $33,400 in federal income assistance. As a result, these policies increased their household incomes by 216 percent, to nearly $49,000.
The story is very similar for households in the broader middle class, although not as extreme. After netting their federal taxes paid, direct federal benefit policies raised the incomes of households in the second quintile by 63 percent, the incomes of households in the middle quintile by 23 percent, and, remarkably, the incomes of households in the fourth quintile by 1 percent. This is the first year that households in the fourth quintile have been net beneficiaries of benefit programs.
Federal Taxes Reduce Average Incomes in the Highest Quintile and the Top 1 Percent
The story changes completely for wealthier households. On average, households in the highest quintile paid far more in taxes in 2021 than they received in direct federal benefits. CBO estimates they paid an average of nearly $104,000 in taxes and received $17,000 in benefits. As a result, they saw their incomes fall by an average of $86,600, or 21 percent.
At the very top end of the income scale, the story is even more dramatic. Households in the top 1 percent paid an average of roughly $931,400 in federal taxes and received $17,700 in benefits. As a result, federal tax and spending policies reduced the incomes of households in the top 1 percent by over $900,000, or 29 percent.
Individual Results Add Up to Considerable Redistribution
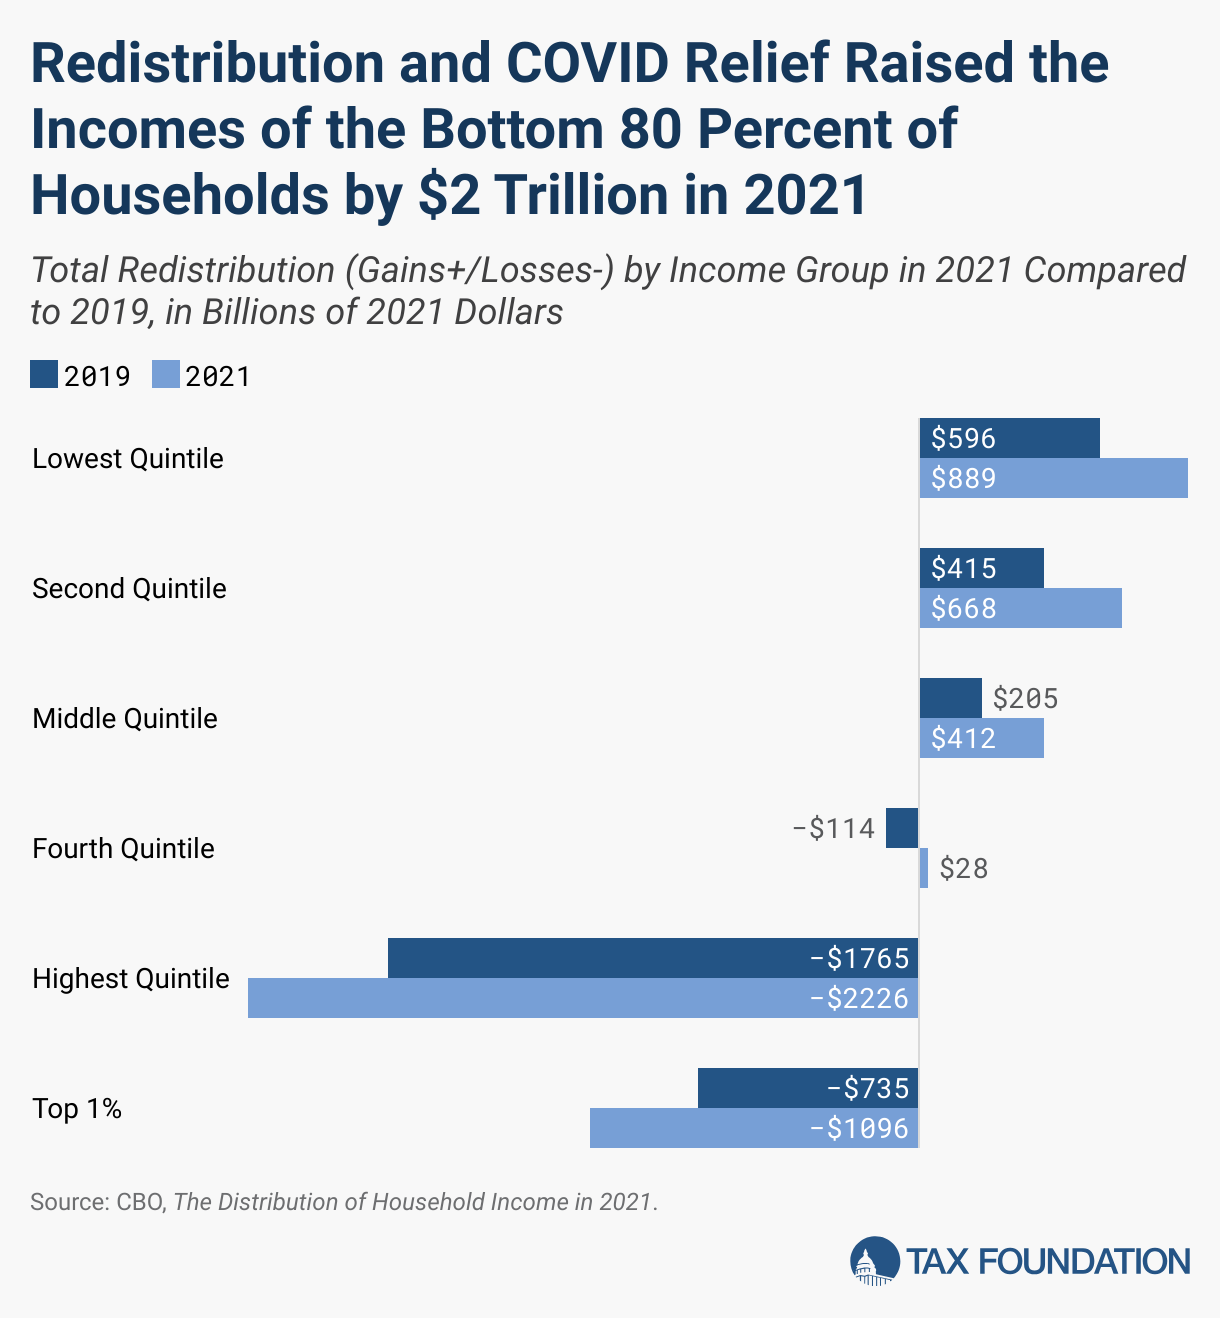
Figure 1 compares the aggregate amount of redistribution by income group in 2021 (a COVID year) to 2019 (a pre-COVID year). Positive numbers indicate that the income group received more in benefits overall than they paid in total taxes, whereas negative numbers indicate that the income group paid more in total taxes than they received in benefits.
We can see that the amount of redistribution in 2021 was much more than in 2019. For example, in 2019, the bottom three quintiles received a total of $1.2 trillion more in benefits than they paid in taxes. Meanwhile, the fourth quintile lost $114 billion in income and the highest quintile lost nearly $1.8 trillion because of how much more they paid in taxes above what they received in benefits. The top 1 percent saw their collective incomes fall by $735 billion due to redistribution.
In 2021, by contrast, the bottom three quintiles plus the fourth quintile received a total of nearly $2 trillion more in benefits than they paid in taxes. On the other end of the income scale, we can see that progressive fiscal policy reduced the incomes of households in the highest quintile by $2.2 trillion in 2021; roughly half of this amount, or about $1.1 trillion, came from households in the top 1 percent alone.
Overall, COVID relief made 2021 a very unique year. The combined effect of the traditional benefit programs plus the COVID relief tipped the balance so that the bottom 80 percent of American households received more in federal benefits than they paid in taxes.
The Fiscal System Has Historically Favored Low-Income Households
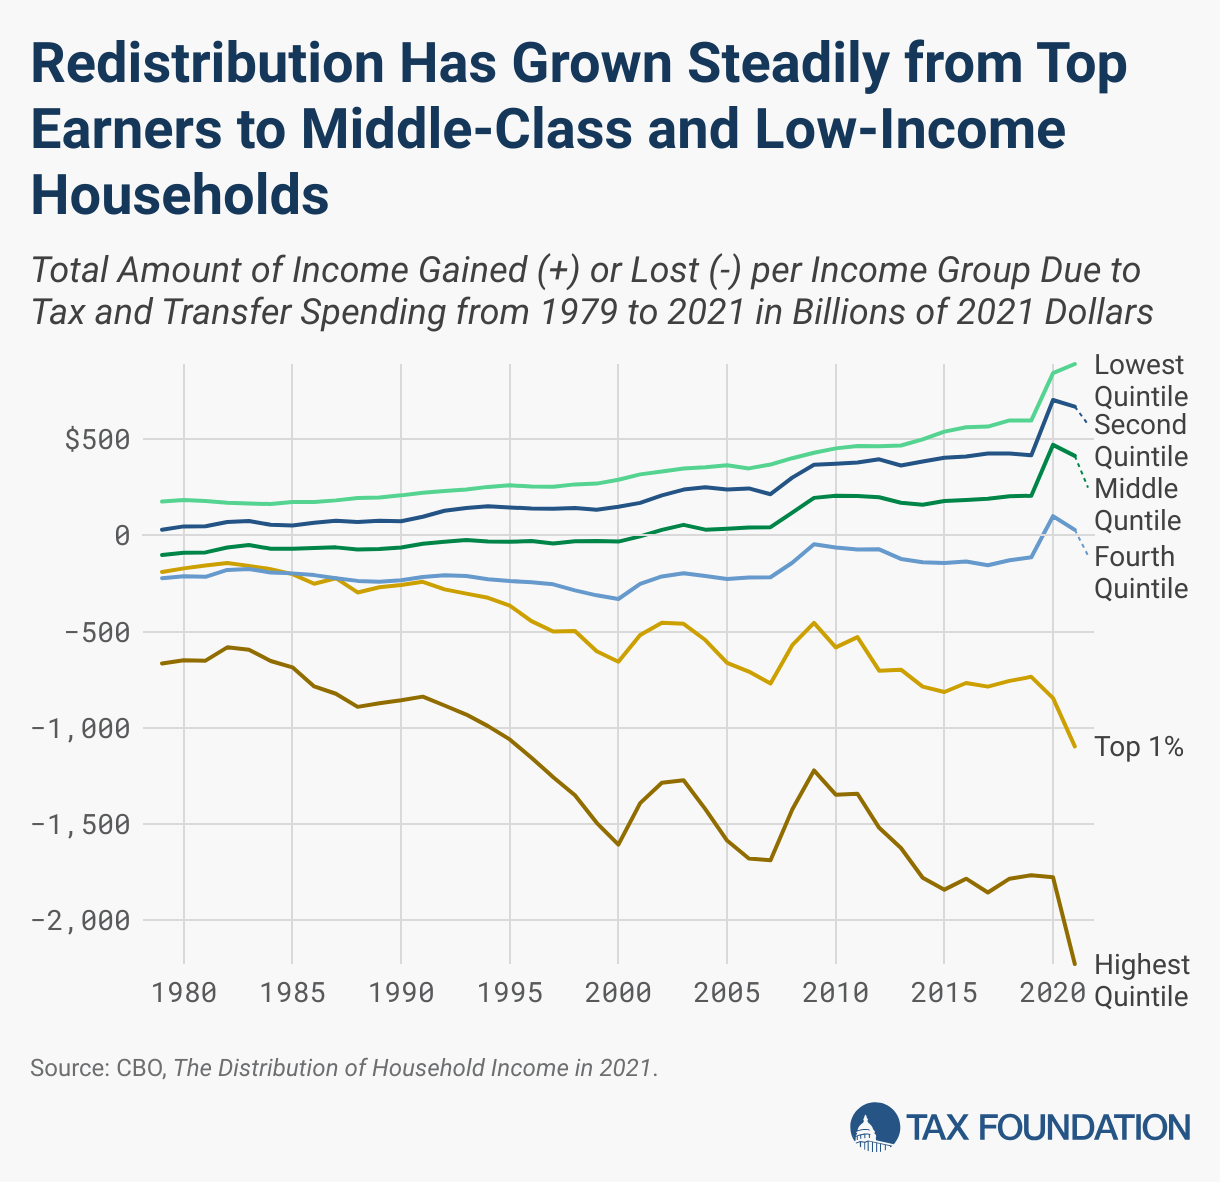
Figure 2 paints an interesting picture of the increasing progressivity of the federal tax and benefit system since 1979. CBO adjusted the data series to 2021 dollars to allow for an apples-to-apples comparison over the decades.
Unsurprisingly, since 1979, households in the lowest quintile and the second quintile have received more in federal benefits than they paid in taxes. Tax policy was a large factor in this trend, especially since the mid-1990s, as shown in Table 7 of CBO’s supplemental data to the report.
Successive expansions of the earned income tax credit and the creation of the child tax credit dramatically reduced the income tax liabilities of these low-income households. Indeed, the doubling of the child tax credit from $500 to $1,000 in the 2001 tax bill, combined with making the credit partially refundable, fully eliminated the income tax liability for households in the first and second quintiles and gave them a large tax subsidy.
Middle-Income Households Are Also Net Beneficiaries
However, the more significant story is the changing fortunes of households in the middle quintile. These households also benefited substantially from the expansion of tax credits, and beginning in 2002—following the doubling of the child tax credit—they became net beneficiaries from federal fiscal policy rather than net contributors. Since then, the gap between the middle quintile’s federal benefits received and federal taxes paid has grown steadily.
For decades, taxpayers in the fourth quintile typically paid more in taxes than they received in benefits. In 2021, however, they received more in social insurance and means-tested benefits than they paid in taxes. This is yet another indication that the burden of the fiscal system is resting more and more on households in the highest quintile.
The Burden of the Fiscal System Is Falling Increasingly on the Highest Quintile
The most obvious trend on this chart is the downward slope representing the increased fiscal burden on households in the highest quintile and, more recently, those in the top 1 percent. In 1979, the fiscal system lowered the aggregate income of households in the highest quintile by $666 billion in constant 2021 dollars. By 2000, their reduced earnings had more than doubled to $1.6 trillion, growing to $2.2 trillion by 2021.
The top 1 percent of households have also seen their contributions to the fiscal system climb dramatically over the past four decades. In 1979, the fiscal system reduced their aggregate incomes by $191 billion in 2021 dollars. By 2000, that amount had more than tripled to $657 billion, growing to nearly $1.1 trillion by 2021.
CBO’s findings provide some needed perspective for the current tax and spending debate. Some may argue the system is too progressive while others may say it is not progressive enough. But CBO’s data clearly shows that the system is doing what a progressive system is intended to do—raise the incomes of the poor and middle class, while reducing the incomes of upper-income households. It is up to voters and lawmakers to decide if this amount of redistribution is too much or too little.
Stay informed on the tax policies impacting you.
Subscribe to get insights from our trusted experts delivered straight to your inbox.
Share