Ethereum Price Analysis: Struggling to Break Above $2,420
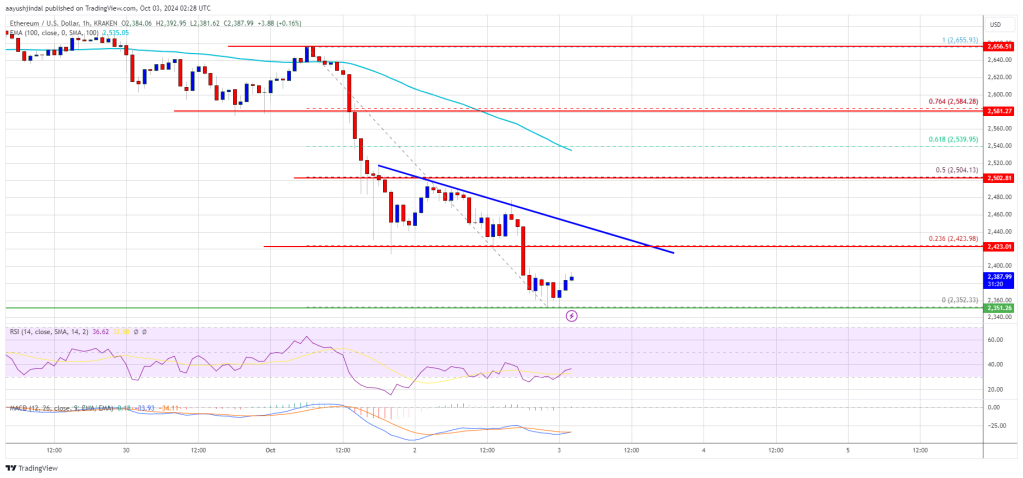
Ethereum price has seen a decline below the $2,450 level and is currently consolidating, facing resistance around $2,425.
- Ethereum has dropped below the $2,400 zone.
- The price is trading below $2,420 and the 100-hourly Simple Moving Average.
- A bearish trend line with resistance at $2,425 is forming on the hourly chart of ETH/USD.
- For a potential recovery, ETH must hold above the $2,350 support level.
Price Movement and Key Levels
Ethereum price remains in a bearish trend and has extended losses below $2,550, dipping below key support levels like Bitcoin. After hitting a low near $2,352, the price is now consolidating losses.
With the price trading below $2,420 and the 100-hourly Simple Moving Average, hurdles are seen around the $2,420 level. A breakout above $2,535 could signal further gains, with upside potential towards $2,650.

Potential Downside and Support Levels
If Ethereum fails to break above $2,420, it could see further downward movement. Initial support is at $2,350, with a significant level at $2,320. A clear break below $2,320 may lead to a drop towards $2,250, with additional support at $2,150.
Technical Indicators
Hourly MACD – The MACD for ETH/USD is bearish.
Hourly RSI – RSI for ETH/USD is below 50.
Summary and Conclusion
Ethereum price is struggling to recover above $2,425 and faces challenges near key resistance levels. While a potential breakout could lead to gains towards $2,650, failure to breach $2,420 may result in further losses. Traders should monitor support levels at $2,350 and $2,320 for potential price movements.
