


Key Findings in Wireless Taxes and Fees
- A typical American household with four phones on a family share plan, paying $100 per month for taxable wireless service, would pay nearly $320 per year in taxes, fees, and government surcharges—up from $294 in 2023.
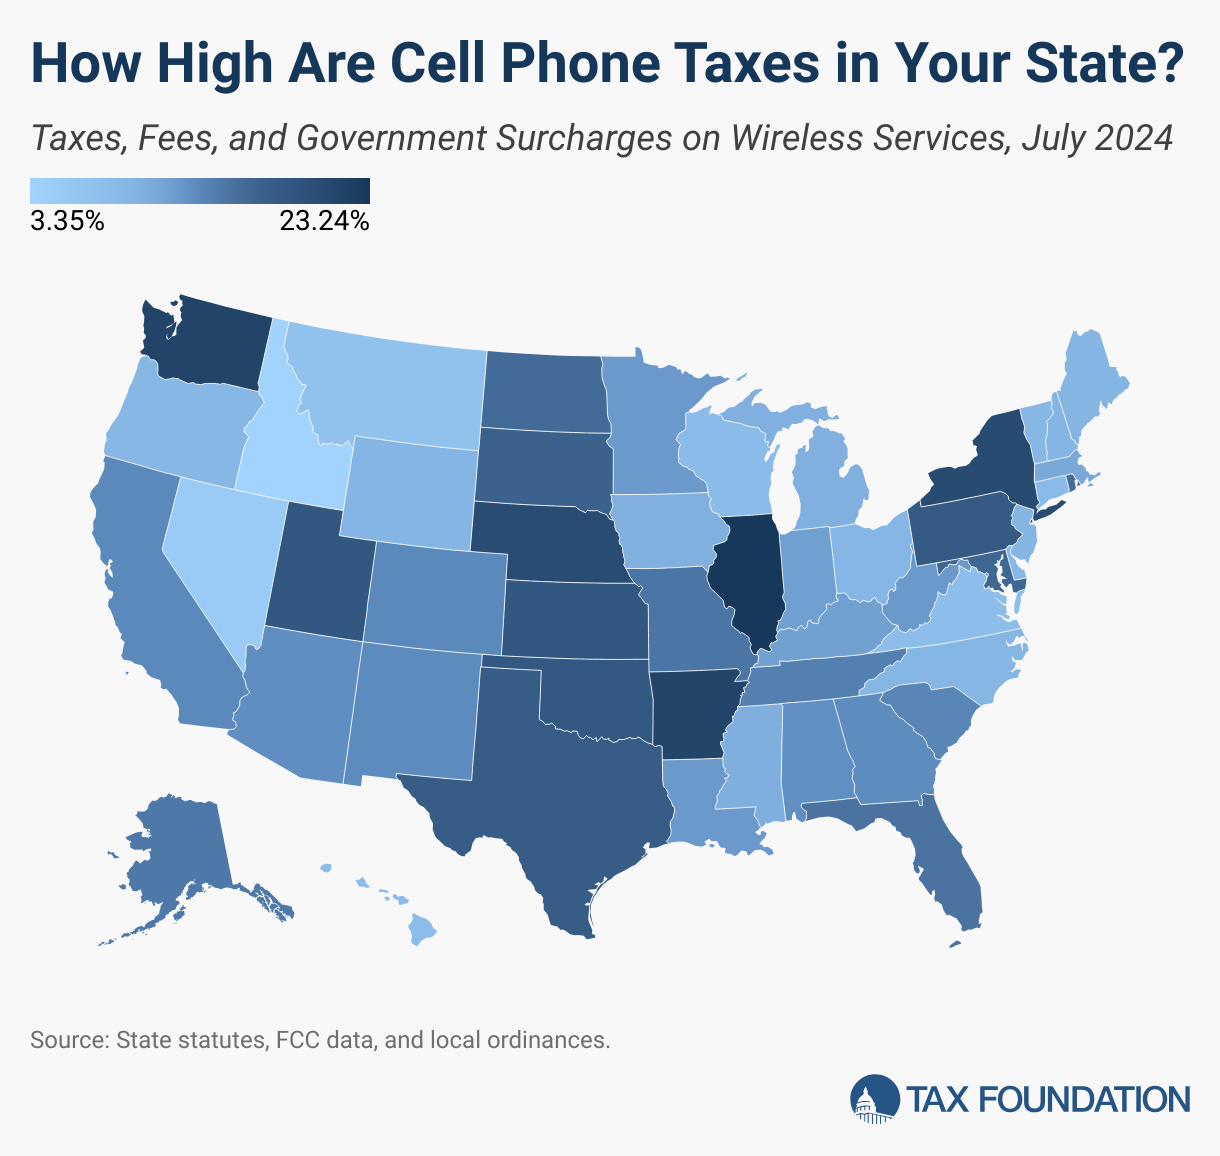
- Wireless taxes, fees, and government surcharges now comprise a record-high 26.8 percent of taxable voice services. Illinois residents face the highest burden at 36.0 percent, followed by Washington at 34.4 percent and Arkansas at 34.2 percent. Idaho residents pay the lowest at 16.1 percent.
- Oklahoma experienced the largest increase in 2024, jumping from 26.9 percent to 31.1 percent due to higher 911 fees and State Universal Service Fund charges.
- The Federal Universal Service Fund charge rose significantly this year from 10.8 percent to 12.8 percent, with state and local taxes also increasing from 13.7 percent to 14 percent.
- The federal Permanent Internet Tax Freedom Act prevents state and local taxes on wireless internet access. Without this protection, taxes on wireless bills could be much higher.
- Wireless provider charges have decreased by 29 percent since 2012, from $47.00 per line per month to $33.56 per line, but wireless taxes, fees, and surcharges increased from 17.2 percent to 26.8 percent of the average bill.
- Approximately 80 percent of low-income adults and 75 percent of all adults live in wireless-only households. Wireless taxes disproportionately impact low-income families.
Introduction to Increased Wireless Taxes in 2024
Taxes and fees for the typical American wireless consumer have significantly increased from 24.5 percent of the average monthly bill in 2023 to 26.8 percent in 2024. This includes an average of 14.0 percent state and local taxes and a Federal Universal Service Fund (FUSF) rate of 12.8 percent.
This report, in its 15th edition, tracks the taxes, fees, and surcharges imposed on wireless voice services by various government levels. It uses consistent methodology to compare percentage rates of wireless taxes, converting flat fees like per-line 911 fees to percentage terms using the average monthly industry revenue per line.
As markets, product offerings, and policies evolve, our report includes alternative calculations to accommodate these changes. We compare taxes as a percentage of both taxable and non-taxable services, illustrating how internet access exemptions impact tax collections and effective rates.
Despite a decrease in average charges per line over the past decade—falling from $47.00 to $33.56—the reduced consumer cost has been offset by higher taxes. By the end of 2023, there were about 558 million wireless subscriber connections.
In 2024, wireless subscribers will collectively pay approximately $12.4 billion in taxes to local and state governments:
- $5.3 billion in sales taxes and other non-discriminatory consumption taxes
- $4.0 billion in state and local 911 and 988 fees
- $3.1 billion in additional telecommunications-specific taxes
Wireless services are often the sole means of communication for low-income Americans, with 80 percent of low-income adults and 75 percent of all adults living in wireless-only households.
Record-High Wireless Taxes and Fees in 2024
Wireless service taxes, fees, and surcharges have reached a new pinnacle, driven by an increase in both the FUSF rate and state and local taxes. The FUSF surcharge rate alone increased from 10.8 percent to 12.8 percent.
Since 2017, the FUSF rate has been on the rise and this trend continues into 2024 due to declining telecommunications service costs and a shift to internet access.
Figure 1 ranks states by wireless tax burden, with Illinois topping the list at almost 23 percent. New York, Nebraska, Arkansas, and Washington round off the top five, while Idaho, Nevada, and Montana have the lowest rates.
Analysis of Wireless Taxes by Type
911 and 988 Fees
Most states impose per-line fees for 911 services, varying widely—zero in most Missouri counties to $5.00 per line in Chicago. In 2024, multiple states, including Alabama and South Dakota, increased their 911 fees.
The new 988 fee, introduced in 2021, appears on bills in several states to support suicide prevention hotlines. In 2024, new 988 fees were implemented in states like Colorado and Maryland.
State Universal Service Funds (SUSF)
Twenty-one states and Puerto Rico levy their own SUSF fees for similar purposes as the federal FUSF. States like Texas, Oklahoma, and Kansas have made substantial increases to their SUSF charges.
State Wireless Taxes
Thirteen states impose wireless taxes in addition to or instead of sales taxes, often at higher rates. Examples include Illinois, which is planning a cap reduction on local wireless taxes starting in October 2024.
Local Wireless Taxes
Local governments in 14 states also tax wireless services above local option sales taxes, further adding to the tax burden. States with some of the highest local taxes include California, Illinois, and Washington.
Understanding the Regressive Nature of Wireless Taxes
Wireless taxes are highly regressive, burdening low-income users the most. With increasing per-line impositions, such as for 911 and SUSF surcharges, these regressive effects are exacerbated.
Excessive taxes raise wireless service costs at a time when they are increasingly essential for accessing education, healthcare, and work. High taxes disproportionately affect low-income families.
Table 5 demonstrates the impact of high local taxes on families in various cities, with a typical family in Chicago paying over $400 annually in local wireless taxes.
Alternative Comparisons of Wireless Tax Burdens
Wireless services have evolved significantly since this report’s inception. Initially, all components of the wireless bill were taxed. Now, most plans include both taxable services and non-taxable internet access.
To better understand the tax burden, Table 6 presents alternative comparisons, showing how states relying on per-line taxes burden lower-income users more than those with percentage-based taxes. Certain states like Illinois and Maryland have higher overall tax rankings due to their reliance on per-line taxes, which are regressive by nature.
The Economic Impact of Excessive Wireless Taxes
Policymakers should be wary of expanding wireless taxes due to their regressive nature and potential to slow investment in wireless infrastructure. Such investments are vital for broader economic benefits and support sectors like transportation and education.
Excessive wireless taxes could hinder long-term revenue growth, outweighing short-term gains by reducing investment in wireless networks, vital for modern economic activities.
Conclusion
Wireless consumers continue to face high taxes, fees, and government surcharges, with a significant portion being discriminatory. These taxes place undue burdens on low-income families and stifle investments essential for advancing wireless infrastructure.
To counteract these regressive impacts, states should consider broad-based tax reforms that do not disproportionately affect low-income consumers or deter critical infrastructure investments.
Stay informed on the tax policies impacting you.
Subscribe to get insights from our trusted experts delivered straight to your inbox.
Appendix
Methodology
The report uses consistent methodology, comparing national, state, and local tax rates on wireless services. Trends impacting tax rates include increasing internet access consumption, flat rate taxes, and FUSF safe harbor calculations.
What Are Universal Service Funds?
The Federal Universal Service Fund
Administered by the FCC, the FUSF subsidizes telecom services for schools, libraries, hospitals, and underserved areas. The surcharge rate, reassigned quarterly, rose to 34.4 percent for the interval beginning July 2024.
State Universal Service Funds
States may supplement FUSF with their SUSF programs funded by intrastate telecom charges. SUSF charges, like those in Arkansas, Texas, and Kansas, often contribute significantly to the high tax burden in these states.
<#table-577 from cache#>
Footnotes
[1] The program subsidizes telecom services for various public services and rural areas.
[2] Includes watches, tablets, and other devices. Robert Roche, “CTIA’s Wireless Industry Indices Report, Year End 2022 Results,” CTIA, July 2023.
[3] Stephen J. Blumberg and Julian V. Luke, “Wireless Substitution: Early Release Estimates from the National Health Interview Survey, July-December 2023,” CDC, June 2024.
[4] US Census, 2022 Service Annual Survey, Table 4, “Estimated Sources of Revenue for Employer Firms, 2013 Through 2022.”
[5] Missouri imposes a 911 fee on prepaid services.
[6] Ulrik Boesen, “Cutting the Cord from Cable Has States Courting New Revenue Streams,” Tax Foundation, July 19, 2021.
[7] US Census Bureau, 2023 Service Annual Survey, Table 4, “Estimated Sources of Revenue for Employer Firms, 2013 Through 2022.”
[8] International Chamber of Commerce, “ICC Discussion Paper on the Adverse Effects of Discriminatory Taxes on Telecommunications Service,” Oct. 26, 2010.
[9] US Census Bureau, “Service Annual Survey Latest Data (NAICS-basis),” Nov. 23, 2021.
[10] Report assumes use of the FCC safe harbor percentage for consistent multiyear comparisons.
[11] Consumers’ Research v. FCC, US Court of Appeals for the Fifth District (2024).
Share